Breif on TxHelpdesk Dashboard
The dashboard gives you various insights about the system and can lead you to make better decisions by looking at the flow and the state of the tickets.
To view Dashboard, log in to your TxHelpdesk Account and click on the Dashboard icon ![]() visible in the sidebar of the ticket listing page
visible in the sidebar of the ticket listing page
The above Dashboard image shows the data of all time, you can change the stat to today's stat, by just clicking on the box as shown in the image below.
TxHelpdesk dashboard divides into different sections so that you can have an insight of different sections in one window.
1. Supervisor
2. My Dashboard
3. Queue
4. Agent
5.Ticket
6. SLA Section
So, let's go in brief on all the sections, one by one
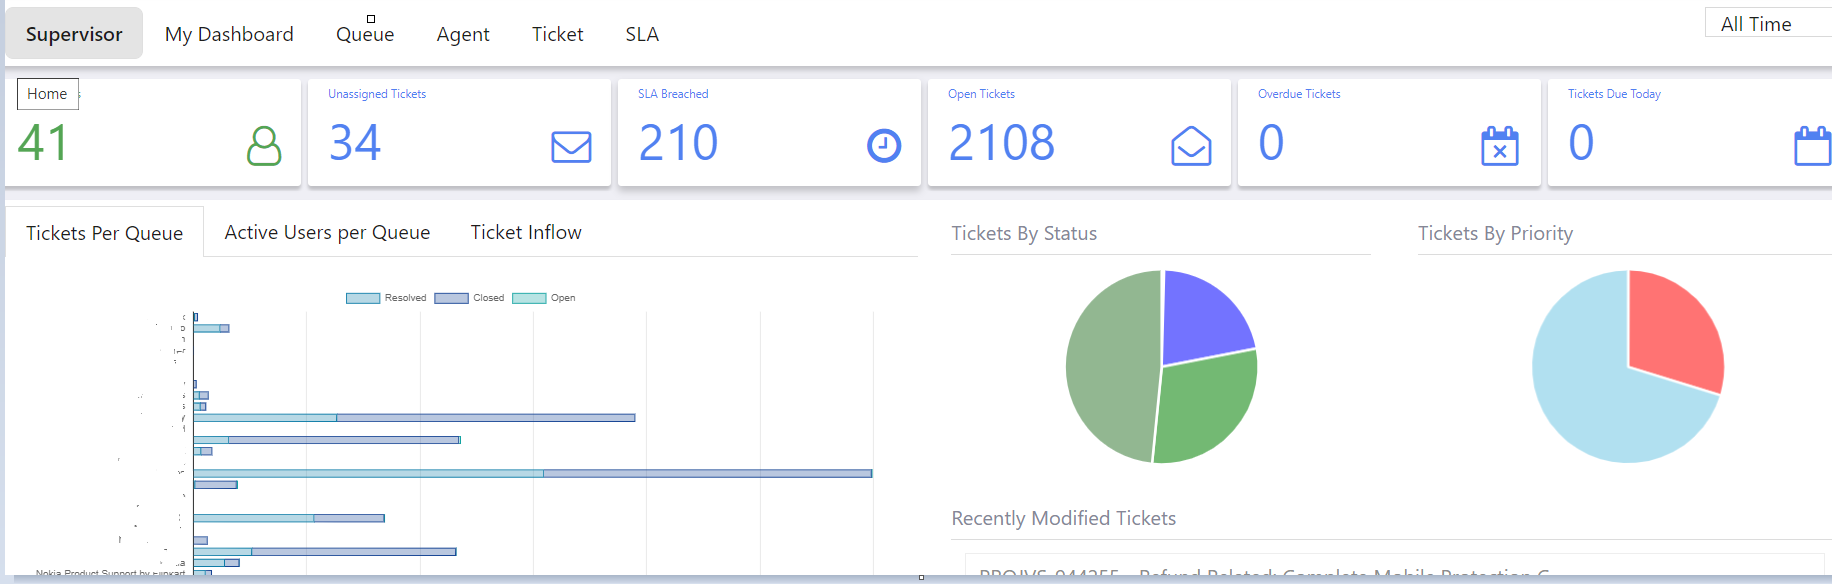
Supervisor Section:: This section will show data on active users, SLA breached, number of tickets that are open,
Active Users- Number of Users who are logged in or active
Unassigned Tickets - Number of tickets that are unassigned.
SLA breached- Total number of tickets for which SLA target has been breached
Open Tickets- Total number of tickets that are on open status.
Overdue Tickets- Overdue tickets are those that have not been resolved within the due time specified by the SLA.
Tickets Due Today: Tickets due for the present date.
Today's Reply Count- Total Number of public replies sent by the user for the present date
Graph
Ticket Per Queue::Bar Graph shows a graphical representation of the total number of tickets at respective status queues. Hovering over the data points in the graph shows you the corresponding ticket count, by clicking on it, it will take you to its page.
Active User Per Queue:- Shows the graphical representation of the total number of users' active queues.
Ticket Inflow: Ticket Inflow Graph shows a graphical representation of the number of incoming tickets on a day wise scale, Hovering over the data points in the graph shows you the corresponding ticket count.
The Pie Charts show the tickets by status and priorities, and clicking on a slice will take you to its’ page.
My Dashboard Section: This Section will show only the data of the user who has logged in
Queue Section: This shows the data queue wise. the first row shows
User: Total number of Users available queues
Ticket Open:- Total number of tickets whose behavioural status is open, Open behaviour can be classified into Open, Reopened, WIP, Duplicate.
Ticket Closed:- Total number of tickets whose behavioural status is closed. Closed behaviour can be classified into: Resolved and Closed.
Ticket: It shows the count of total tickets and total unassigned tickets in open status.
Agent Section: This section will list out all the agent names and their status. The number of tickets in Open behaviour, Close behaviour, Tickets assigned to respective agents and are in open status.
The user also has an option to download the data in CSV format.

Ticket Section: Only the open behaviour tickets are considered in the calculation.
Ageing in Hours:: Hourly difference from freshly created ticket time to the duration which is still on open status.
Ageing in Days: Daywise difference from freshly created tickets to the days
SLA Section: This section notifies the percentage of tickets o a particular queue that approaches its SLA deadline.
About to breach
Already breached